Olivia Berger · 10 September 2026
How Azure's Sustainability Metrics Are Driving Efficiency Upgrades in Eastern European University Data Centers
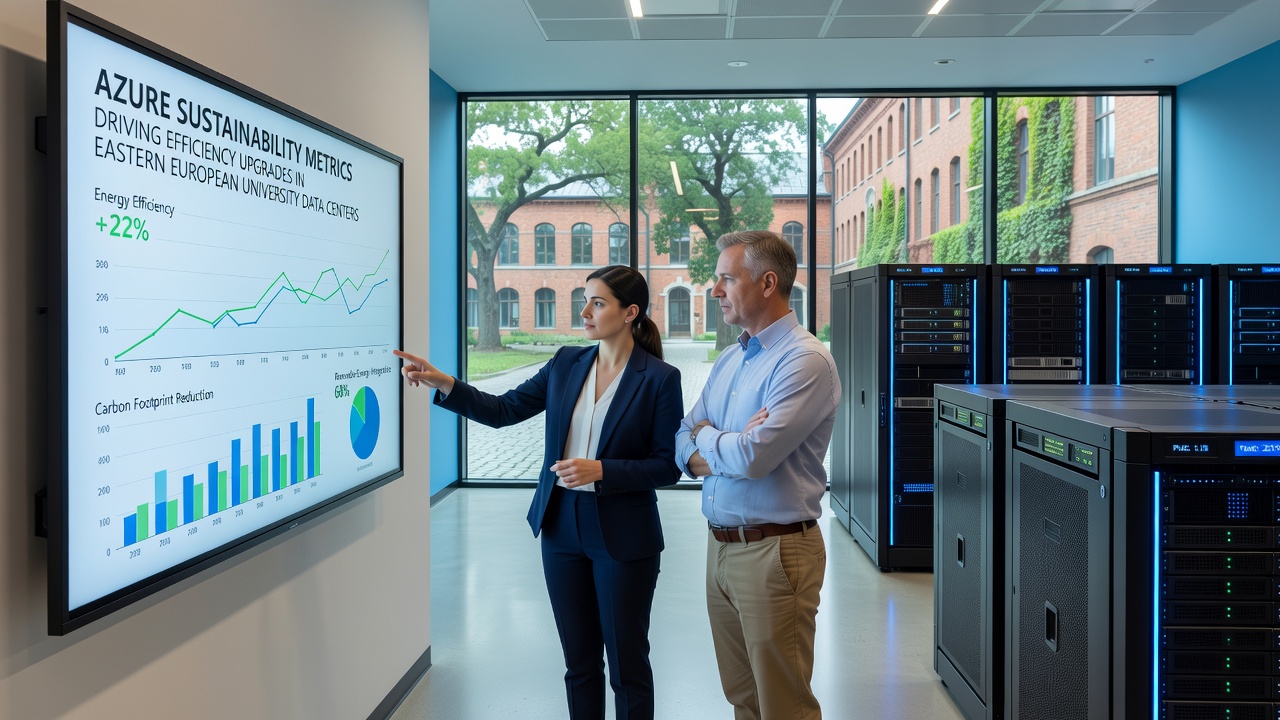
Azure's suite of sustainability metrics has prompted measurable changes across Eastern European university data centers since the platform expanded its carbon-aware tooling in recent years, and researchers at institutions in Hungary, Romania, and Slovakia have responded by integrating those metrics into operational planning. The tools track power usage effectiveness, water consumption, and renewable energy matching percentages while generating reports that align with regional energy regulations.
Azure Sustainability Metrics in Practice
University IT teams access the Emissions Impact Dashboard and related APIs to monitor real-time carbon intensity alongside traditional performance indicators, and this integration reveals where cooling systems or server utilization patterns exceed internal targets. Data centers at institutions like those in Budapest and Bucharest have adjusted workload scheduling to shift non-critical research computations to periods of lower grid carbon intensity, a change that follows directly from the metrics' hourly granularity. Observers note that the same dashboards also quantify avoided emissions when universities migrate on-premises servers to Azure regions powered by higher renewable mixes, creating a feedback loop that justifies further infrastructure investments.
Regional Upgrades Triggered by Metric Insights
Eastern European universities began rolling out liquid cooling retrofits and denser rack configurations after the metrics highlighted excessive energy overhead in older air-cooled halls, and several facilities completed these changes ahead of September 2026 compliance checkpoints tied to EU energy directives. The upgrades include variable-speed fans, hot-aisle containment, and direct-to-chip cooling loops that lower power usage effectiveness values from the 1.6–1.8 range down to 1.3 or below in documented cases. Procurement records show corresponding increases in high-efficiency power supplies and GPU clusters optimized for Azure's carbon-aware scheduling APIs, allowing research groups to maintain compute capacity while reducing total facility energy draw.

Case studies from Romanian and Slovak technical universities illustrate the pattern: after loading twelve months of Azure metric exports into internal models, facilities teams identified weekend server idling as a major contributor to unnecessary emissions, prompting automated shutdown policies that cut baseline power consumption without interrupting scheduled academic workloads.
Data Sources and Measurement Standards
According to figures published by the International Energy Agency, data centers account for roughly 1–1.5 percent of global electricity use, and Azure's standardized reporting lets universities compare their operations against those benchmarks. The platform's methodology matches consumption data against location-specific grid factors published by European grid operators, producing outputs that align with ISO 14064 and the GHG Protocol. Academic researchers have cross-referenced these outputs with independent audits from national energy agencies in Poland and the Czech Republic, confirming that the reported reductions track with actual meter readings at the substation level.
Future Outlook Through 2026 and Beyond
University procurement cycles now incorporate Azure sustainability scorecards as selection criteria for cloud service contracts, and this practice has accelerated vendor negotiations around renewable energy attribute certificates tied to specific Azure regions serving Eastern Europe. Facilities planners anticipate further metric-driven refinements once Azure releases its next-generation water-stewardship dashboards later in 2026, which will add granularity on evaporative cooling losses in climates typical of the region.
Conclusion
Eastern European university data centers continue to translate Azure's sustainability metrics into concrete hardware and operational changes that lower both energy costs and reported emissions, and the pattern shows no sign of slowing as new reporting features and regional grid improvements come online. The approach relies on transparent data flows between cloud provider and campus teams rather than prescriptive mandates, allowing each institution to prioritize upgrades that match its research computing profile and budget cycle.